Portfolio Details
Explore this amazing project and discover the creativity behind it
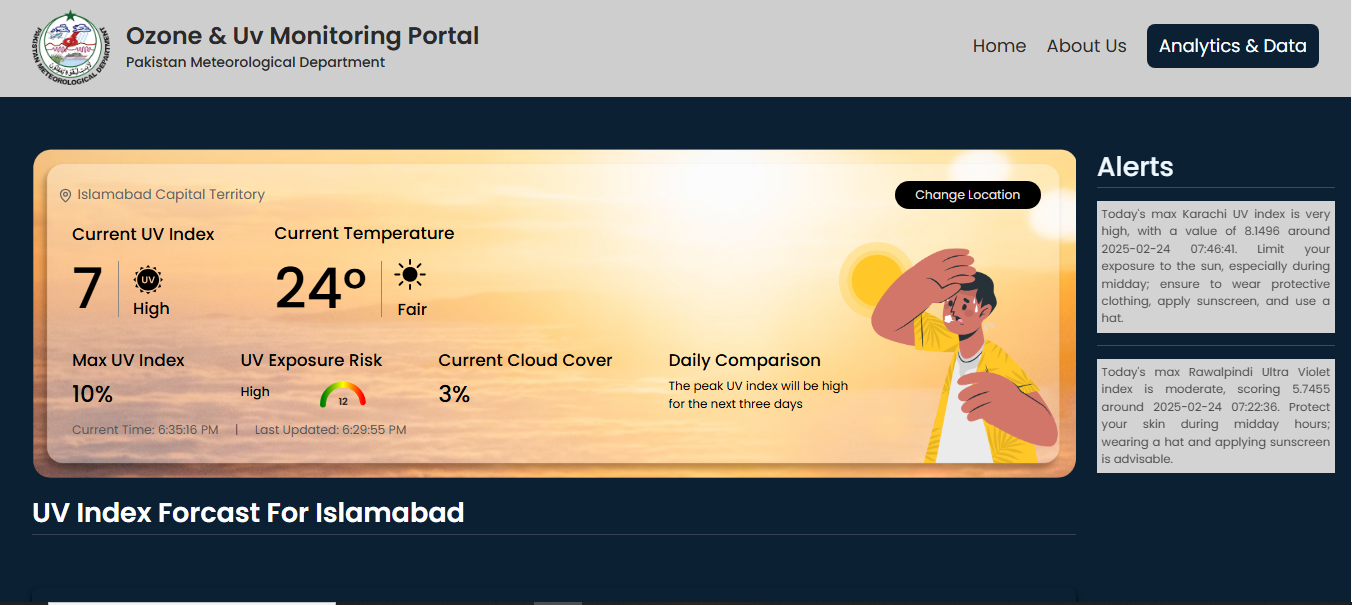
Ozone & UV Monitoring Dashboard
by Mahnoor Mukhtar
•
web
Created 6 months ago
About This Project
Visualized ozone, UV index, and cloud cover on interactive maps.
Added daily summaries with forecasted trends.
Optimized performance for large geospatial datasets.
Automated data fetching for up-to-date monitoring.
Added daily summaries with forecasted trends.
Optimized performance for large geospatial datasets.
Automated data fetching for up-to-date monitoring.
Technologies Used
CSS
Express.js
Git / GitHub
JavaScript
MongoDB
Node.js
React
REST API
Tailwind CSS
Project Links
About the Creator
M
Mahnoor Mukhtar
@MahnoorMukhtar
Interested in this work?
Sign in to contact Mahnoor Mukhtar and explore collaboration opportunities.
Sign In to Contact